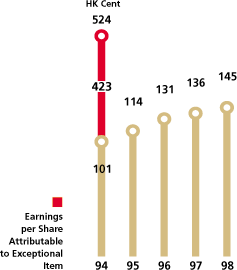
Earnings per share
for the year amounted to HK$1.45, up 6.3% over 1997.

IN 1998 THE GROUP'S TURNOVER INCREASED BY 13.3% OVER THE PREVIOUS YEAR.

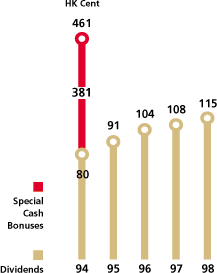
Dividends per share for the year will amount to HK$1.15 per share compared with HK$1.08 for 1997. |
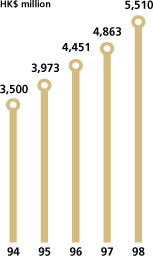
Turnover in 1998 totalled HK$5,510 million, an increase of 13.3%, as compared with the previous year. | |
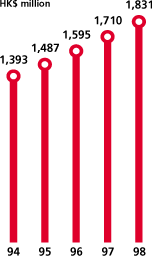
Shareholders' funds stood at HK$1,831 million at year end compared with HK$1,710 million at the end of 1997. |
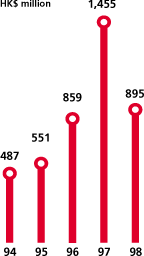
Capital expenditure incurred by the Group during the year was HK$895 million, down from 1997's figure of HK$1,455 million. | |
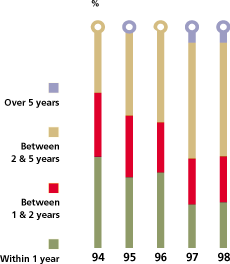
Debt maturity profile of bank loans and overdrafts is set out in note 20 on the accounts on pages 78 and 79 of this report. |
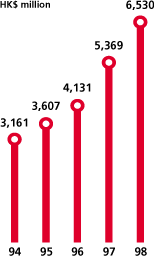
Total assets of the Group amounted to HK$6,530 million, an increase of 21.6% over the prior year. |
RESULTS FOR THE YEAR
The Group's profit attributable to shareholders for the year ended 31 December 1998 was HK$585.5 million (1997 - HK$550.8 million), representing an increase of 6.3% over the previous year. Earnings per share for the year amounted to HK$1.45 (1997 - HK$1.36). The Group's profit was mainly derived from the franchised bus services operated by The Kowloon Motor Bus Company (1933) Limited.
RESULTS OF THE KOWLOON MOTOR BUS COMPANY (1933) LIMITED ("KMB")
The profit from the franchised bus operations of KMB for the year amounted to HK$598.4 million (1997 - HK$556 million), representing an increase of 7.6% over the previous year.
Revenue and Operating Costs
Revenue and operating costs related to KMB franchised bus operations increased by 10.6% and 11.2%, respectively, as compared with the previous year. The increase in revenue was mainly due to the fare increase which came into effect on 1 December 1997 and the introduction of more air-conditioned buses and new routes. The increase in operating costs was mainly due to a rise in payroll costs, an increase in interest expenses and additional costs incurred for enhancement of the quality of service. An average pay increase of 5.39% was awarded to all daily-rated employees with effect from 1 June 1998 and to all monthly-rated employees with effect from 1 September 1998.
Passengers Carried and Kilometres Travelled
In 1998, a total of 1,034.4 million passenger trips (1997 - 1,051 million) was made on KMB buses, amounting to a daily average of 2.83 million passenger trips (1997 - 2.88 million). This represented a decrease of 1.6% in patronage as compared with the previous year. The decrease was due mainly to a decline in economic activity during the year. The actual distance travelled by KMB buses totalled 302.5 million kilometres (1997 - 301 million kilo-metres). The increase in distance travelled was mainly due to the introduction of new routes and improved frequencies on certain routes.
RESULTS OF LONG WIN BUS COMPANY LIMITED ("LWB")
In 1998, a total of 14.4 million passenger trips (1997 - 2.88 million) was made on LWB buses, a daily average of 39,500 passenger trips (1997 - 13,500). The actual distance travelled by LWB buses totalled 15 million kilometres (1997 - 1.43 million). The increases in patronage and distance travelled were due to the introduction of 12 new routes upon the opening of the new Hong Kong International Airport at Chek Lap Kok. Unfortunately, the number of passenger trips was significantly lower than expected, due mainly to a sharp decline in Hong Kong's tourism industry. LWB recorded a loss of HK$27.1 million in 1998 against a profit of HK$1.5 million in 1997. Capital expenditure incurred by LWB during 1998 amounted to HK$187 million (1997 - HK$254.5 million).
INTERESTS IN ASSOCIATED COMPANY AND JOINTLY CONTROLLED ENTITY
As at 31 December 1998, the Group's total interest in associated company and jointly controlled entity amounted to HK$11.9 million (1997 - HK$17.8 million). The investments were in respect of the operation of three bus routes in Dalian, China and a cross-border bus transport service between Lok Ma Chau and Huanggang, which started operations in 1997. Contributions from these bus operations to the Group were insignificant during the year.
CONSOLIDATED CASH FLOW STATEMENT
In 1998, the net cash inflow from bus operations of the Group was HK$1,411 million (1997 - HK$1,105 million). Total dividends paid to Shareholders during the year amounted to HK$440 million (1997 - HK$428 million). Payments for capital investment and repayment of bank loans amounted to HK$904 million (1997 - HK$1,395 million) and HK$445 million (1997 - HK$157 million) respectively.
The consolidated cash flow statement of the Group for the year ended 31 December 1998 is set out from pages 62 to 64 of this report.
LIQUIDITY AND FINANCIAL RESOURCES
As at 31 December 1998, the Group's net borrowing (i.e. the total borrowing less the cash and deposits at banks) amounted to HK$847 million (1997 - HK$817 million), representing an increase of HK$30 million as compared with 1997. The gearing ratio, representing the ratio of net borrowing to the total share capital and reserves of the Group, decreased from 0.48 in 1997 to 0.46 in 1998. As a result of the increase in total borrowings, the finance charge for the year increased to HK$148 million (1997 - HK$69 million). The increase in finance charge was mainly due to increased borrowing to finance the purchase of new buses and the sharp rises in interest rates during the third quarter of 1998. As at 31 December 1998, cash and deposits at banks of the Group amounted to HK$1,286 million (1997 - HK$563 million).
As at 31 December 1998, the Group had stand-by credit facility totalling HK$10 million. Bank loans and overdrafts at year end amounted to HK$2,133 million (1997 - HK$1,380 million), of which a bank loan of HK$475 million is secured by a first fixed charge over certain of the Group's buses with an aggregate value of HK$539 million at 31 December 1998. At 31 December 1997, certain bank loans of HK$46 million were secured by mortgages over certain of the Group's properties with an aggregate value of HK$151 million. Such securities were discharged upon full repayment of the relevant bank loans during the year ended 31 December 1998. The maturity profile of the bank loans and overdrafts of the Group is set out in note 20 on the accounts on pages 78 and 79 of this report.
CAPITAL EXPENDITURE AND COMMITMENT
Capital expenditure incurred by the Group during the year amounted to HK$895 million (1997 - HK$1,455 million). The breakdown of the capital expenditure incurred is shown in note 10 on the accounts on page 72 of this report.
Capital commitments outstanding and not provided for in the accounts of the Group as at 31 December 1998 amounted to HK$438 million (1997 - HK$964 million). Of these, HK$286 million (1997 - HK$752 million) was for the purchase of buses and other vehicles, HK$38 million (1997 - HK$34 million) was for the improvement of depot facilities and HK$114 million (1997 - HK$178 million) was for the purchase of other fixed assets. As at 31 December 1998, the Group had 283 (1997 - 665) air-conditioned double-deck buses on order for delivery in 1999, of which 134 (1997 - 275) were in various stages of construction. The commitments are to be financed by bank loans and the working capital of the Group.
FINANCIAL SUMMARY
for the year ended 31 December
                          1998     1997     1996        1995        1994
                         HK$'m    HK$'m    HK$'m       HK$'m       HK$'m
========================================================================
Profit and loss account

Turnover                 5,510    4,863    4,451       3,973       3,500
                        ======   ======   ======    ========    ========
Profit before
   exceptional item        679      555      588         540         490
Exceptional item             -        -        -           -       1,711
                        ------   ------   ------    --------    --------
Profit before
   taxation                679      555      588         540       2,201
Taxation                    93        4       62          77          84
                        ------   ------   ------    --------    --------
Profit after
   taxation                586      551      526         463       2,117
Transfer from/(to)
   Development Fund          -        -        2          (2)          -
                        ------   ------   ------    --------    --------
Profit attributable
   to Shareholders         586      551      528         461       2,117
                        ======   ======   ======    ========    ========

Balance sheet

Fixed assets             4,882    4,441    3,342       2,777       2,479
Interest in
   subsidiaries              -        -        -          24           -
Interest in
   associated
   company                  (5)      (2)       -           -           -
Interest in jointly
   controlled entity        17       20        -           -           -
Net current assets
   / (liabilities)          19     (487)    (383)       (239)       (206)
                        ------   ------   ------    --------    --------
Employment of funds      4,913    3,972    2,959       2,562       2,273
                        ======   ======   ======    ========    ========
Financed by:

Share capital              404      404      404         404         404
Reserves                 1,427    1,306    1,191       1,083         989
                        ------   ------   ------    --------    --------
Shareholder's funds      1,831    1,710    1,595       1,487       1,393
Contingency
   provision
   - insurance             299      273      288         175         175
Development Fund             -        -        -           2           -
Minority interests           6        6        -           -           -
Other liabilities        2,777    1,983    1,076         898         705
                        ------   ------   ------    --------    --------
Funds employed           4,913    3,972    2,959       2,562       2,273
                        ======   ======   ======    ========    ========
Earnings per share       $1.45    $1.36    $1.31       $1.14       $5.24
                        ======   ======   ======    ========    ========
Dividends per share      $1.15    $1.08    $1.04    91 cents    80 cents
                        ======   ======   ======    ========    ========
Special cash bonuses
   per share                 -        -        -           -       $3.81
                        ======   ======   ======    ========    ========
========================================================================
| © Copyright 1996-2026 irasia.com Ltd. All rights reserved. |
|
DISCLAIMER: irasia.com Ltd makes no guarantee as to the accuracy or completeness of any
information provided on this website. Under no circumstances shall irasia.com Ltd be liable
for damages resulting from the use of the information provided on this website.
TRADEMARK & COPYRIGHT: All intellectual property rights subsisting in the contents of this website belong to irasia.com Ltd or have been lawfully licensed to irasia.com Ltd for use on this website. All rights under applicable laws are hereby reserved. Reproduction of this website in whole or in part without the express written permission of irasia.com Ltd is strictly prohibited. TERMS OF USE: Please read the Terms of Use governing the use of our website. |