Financial Highlights
| 1997 HK$ millions |
1996 HK$ millions |
Percentage change | |
| Turnover | |||
| Company and subsidiary companies | 44,590 | 36,662 | +22% |
| Share of associated companies | 16,969 | 17,160 | -1% |
| 61,559 | 53,822 | +14% | |
| Earnings before interest expense and taxation | |||
| Company and subsidiary companies | 12,679 | 10,709 | +18% |
| Share of associated companies | 3,744 | 4,208 | -11% |
| Interest income, including share of associated companies | 3,423 | 2,324 | +47% |
| Total earnings before interest expense and taxation (EBIT) | 19,846 | 17,241 | +15% |
| Interest expense, including share of associated companies | 5,129 | 3,248 | +58% |
| Profit before taxation | 14,717 | 13,993 | +5% |
| Taxation | 1,179 | 1,311 | -10% |
| Profit after taxation | 13,538 | 12,682 | +7% |
| Minority interests | 1,272 | 662 | +92% |
| Profit attributable to the shareholders | 12,266 | 12,020 | +2% |
| Total assets | 200,743 | 131,579 | +53% |
| Net debts | 29,601 | 10,416 | +184% |
| Shareholders' funds | 85,589 | 68,899 | +24% |
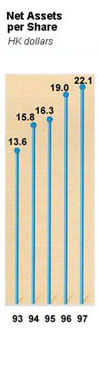
| Net assets per share - book value (HK$) | 22.1 | 19.0 | +16% |
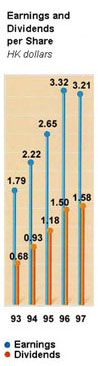
| Earnings per share (HK$) | 3.21 | 3.32 | -3% |
| Dividends per share (HK$) | 1.58 | 1.50 | +5% |
| Dividend cover | 2.0 | 2.1 | -5% |
| Gearing | 31.2% | 14.0% | +123% |
| Return on average shareholders' funds | 15.9% | 18.8% | -15% |
|
|
![]()
Copyright 2001 © Hutchison
Whampoa Limited. All rights reserved.