|
|
||||||||||||||||||||||||||||||||||||||||||||||||||||||||||||||||||||||||||||||||||||||||||||||||||||||||||||||||||||||||||||||||||
|
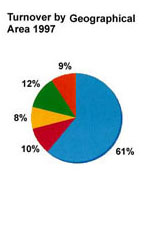
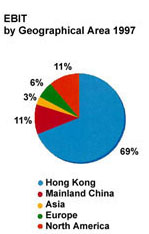
Analysis by Core Business of Group Turnover, EBIT and Profit
The above information includes the Company, its subsidiary companies and its proportionate share of associated companies' amount.
|
||||||||||||||||||||||||||||||||||||||||||||||||||||||||||||||||||||||||||||||||||||||||||||||||||||||||||||||||||||||||||||||||||
| © Copyright 1996-2026 irasia.com Ltd. All rights reserved. |
|
DISCLAIMER: irasia.com Ltd makes no guarantee as to the accuracy or completeness of any
information provided on this website. Under no circumstances shall irasia.com Ltd be liable
for damages resulting from the use of the information provided on this website.
TRADEMARK & COPYRIGHT: All intellectual property rights subsisting in the contents of this website belong to irasia.com Ltd or have been lawfully licensed to irasia.com Ltd for use on this website. All rights under applicable laws are hereby reserved. Reproduction of this website in whole or in part without the express written permission of irasia.com Ltd is strictly prohibited. TERMS OF USE: Please read the Terms of Use governing the use of our website. |